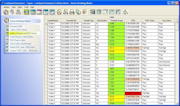
Evaluate any numeric value in the
instrument data results against multiple low and high
limits. Color code table columns and create pass/fail
reports. Associate a list of limits to add limit lines to
each plotted series.
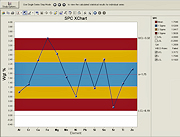
XCharts and RCharts
can be displayed along with the Process Capability
Index (Cpk) and WECO rules result. SPC allows for
early detection and prevention of problems in a
process, which can lead to a significant reduction in
the time required to produce a product or service.
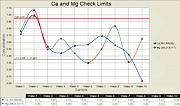
Drag & drop to create sophisticated 2-D and 3-D
rotating charts to analyze relationships in the data.
All standard chart types are supported including
bar, line and pie (and 9 others) with optional data
smoothing. Analyze trends using date-times or
elapsed time intervals.
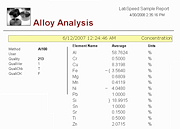
LabSpeed includes a unique reporting engine that hides the
complexity of data relationships, which is common
in instrument data. Simply drag & drop to create
specialized reports with your own company logo
and information layout.